In the previous post, we wrote some functional tests and we encountered our first failing test. Let’s see how we can go about investigating these failures, both on a developer machine and during continuous integration.
First of all, it would be great if you could just understand what went wrong by looking at the test output. That’s why we should follow the same practices that we follow for unit tests:
- Tests should have a clear description that indicate what they're verifying
- Tests should perform only one assertion, so that there's no ambiguity on what has gone wrong
- Assertions should specify a helpful error message
If we follow these practices, we get more value out of the failed test output.
The next step is to debug a test. It’s better to close Phantom and switch over to Selenium and a real browser here, so that you see with your own eyes what is going on. You’ll also need a good IDE that supports debugging JavaScript. IntelliJ IDEA Ultimate is a great choice and it has good support for mocha. Depending on where you right click, you can run an isolated unit test, a scope of tests, an entire file, the entire test suite, etc.
For a free solution, you can try Visual Studio Code. Don’t let the name confuse you, this isn’t Visual Studio. Visual Studio Code is a relatively new editor from Microsoft which runs on all platforms and supports debugging NodeJS applications. To be able to run/debug our functional tests, we’ll need a launch.json configuration like this:
{
    "version": "0.2.0",
    "configurations": [
        {
            "name": "Launch",
            "type": "node",
            "request": "launch",
            "program": "${workspaceRoot}/node_modules/mocha/bin/_mocha",
            "stopOnEntry": false,
            "args": [
                "--timeout=10000",
                "functional_testing/tests/"
            ],
            "cwd": "${workspaceRoot}",
            "preLaunchTask": null,
            "runtimeExecutable": null,
            "runtimeArgs": [
                "--nolazy"
            ],
            "env": {
                "NODE_ENV": "development"
            },
            "externalConsole": false,
            "sourceMaps": false,
            "outDir": null
        }
    ]
}
Don’t be scared: most of these settings are created by Visual Studio Code when you select NodeJS as a debug environment. The only settings I’ve added are:
- program: pointing to the mocha executable within our node modules
- args: specifying a timeout of 10'' for the tests (ample time for Google to load) and pointing to the location of the functional tests
With this, you’ll be able to debug tests, set breakpoints, etc. It’s not as good as IntelliJ but it’s definitely worth a try. Setting a breakpoint is a great way to pause the test, while you switch over to the browser to double check that everything is as you expected (e.g. are the selectors still pointing to existing elements? Are they visible? Are they within the viewport? Is the page loaded or did you get a 500 instead? etc).
Your tests are most likely running also during your continuous integration. When they fail, you have to try to troubleshoot the test locally on your developer’s machine. If you’re lucky, you’ll be able to reproduce the failure and fix it. Problems start when you have a failed test in your CI that passes locally, or, even worse, a test that fails sometimes.
There’s nothing magic here, it all boils down to basic investigation of what is different. Something must be different, that’s why you get different failures:
- phantom vs selenium: it could be that your element is within the viewport for phantom but you'll need to scroll for selenium to find it
- different server: it could be that your web server locally is faster than the CI server, which makes your website under test to perform slower in some cases, which causes timeouts and failed tests
- different load: if you're running tests in parallel, you may be putting higher load on the website you're testing, which causes timeouts and failed tests
Finally, one common source of problems is about forgetting to return a promise in the tests. These are evergreen tests. All tests we’ve seen are using promises. The functions in the tests return the promise and mocha waits for the promise to resolve or fail. If you don’t return the promise, mocha thinks it’s a sync test and moves along.
In general, one thing that would help us to understand more why a test failed is to be able to see what the browser was doing at the point of the failure. Since we have a minimal framework in place, our webdriver_helper, we can extend it with a new feature that will benefit all tests: if a test fails, take a screenshot of the browser at that point. It’s not difficult to implement with a afterEach hook in mocha:
afterEach(function() {
    var currentTest = this.currentTest;
    if (!currentTest.err) {
        return;
    }

    return _this.browser.saveScreenshot(currentTest.title + '.png');
});
To avoid some confusion:
thispoints to the mocha context that gives us information about the current test running._thispoints to the webdriver helper instance.
What does this do? After each test runs, check if it had an error (that’s the currentTest.err check). If it had an error, use the saveScreenshot method of WebDriverIO and save a screenshot. The test’s title can be used in the screenshot name.
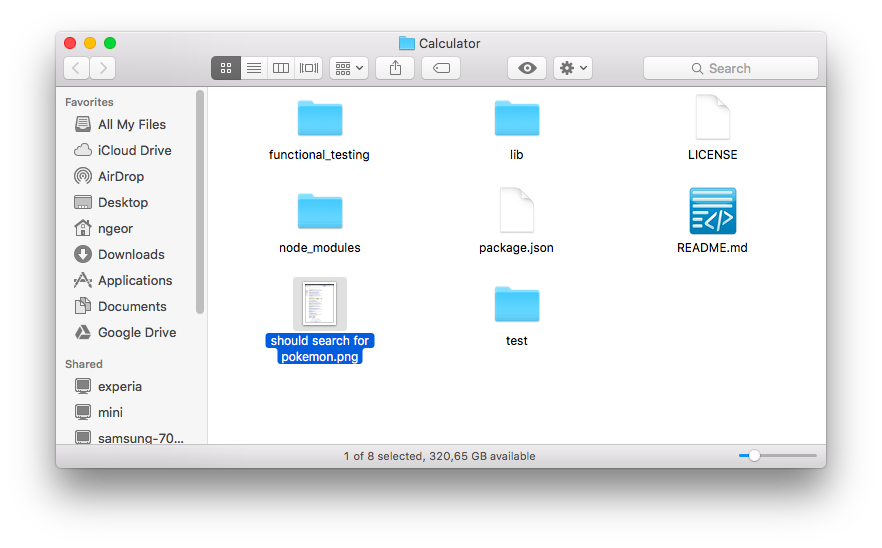
Running our test will fail again, but now we end up with a png file in our working directory.
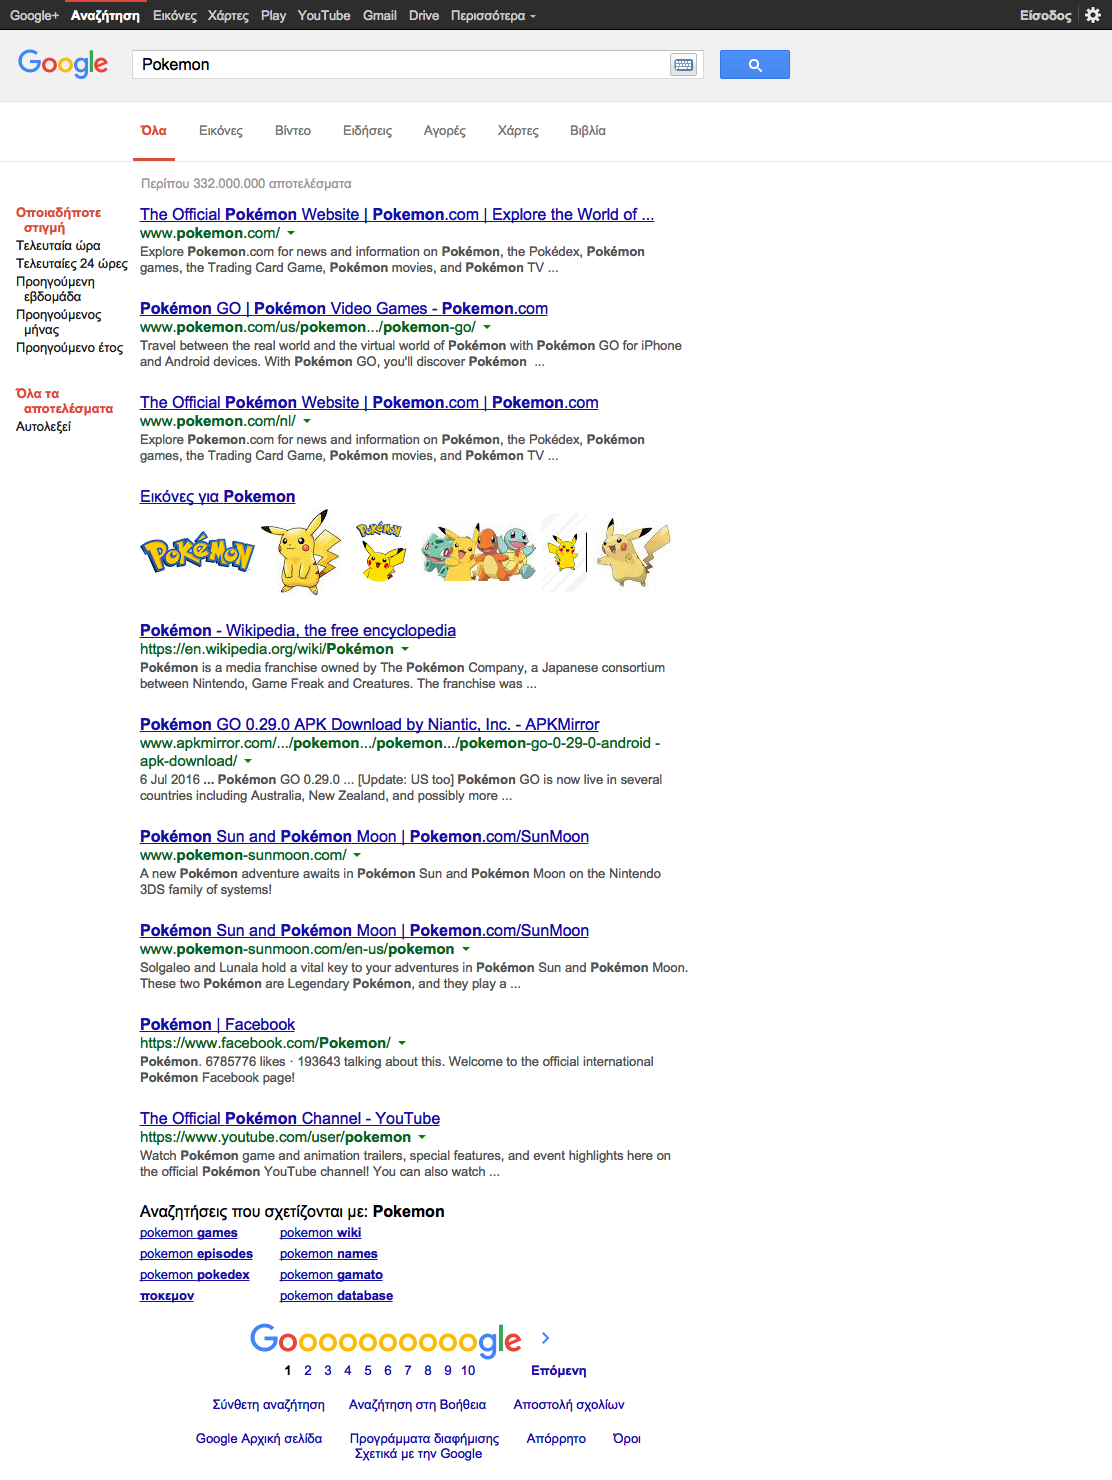
And the screenshot itself indeed validates our findings from the previous post: the page is in Greek, the search result count is higher, and the search duration is not shown in the Greek version.
Configure your CI to consume these files as artifacts and you’ll be able to have more insight of what was really happening on the browser at the time of the failure.
In the next posts, we’ll add a few chai plugins to make our tests a bit easier to write and we’ll start looking into the page object pattern.