TL;DR: I wrote a bash script that walks through your git repository history and calculates number of commits, number of merged pull requests, number of files and total number of lines of code, broken down per month.
If you like creating graphs in Excel, this one is for you. I wrote a prototype (aka works on my machine) script, which is available here, that goes over the history of a git repository. It walks over the master branch, assuming you’re practicing GitHub Flow. For every month, it can measure:
- number of commits
- number of merges (which we can say it's equal to number of merged pull requests)
Furthermore, it can report the state of the repository at the beginning of each month (using the earliest commit in that month):
- number of files
- number of lines of code (aggregating all source code together)
Is this useful? I don’t know. Is it interesting? I find it very interesting. See the following graph, which shows the number of commits on a project at work:
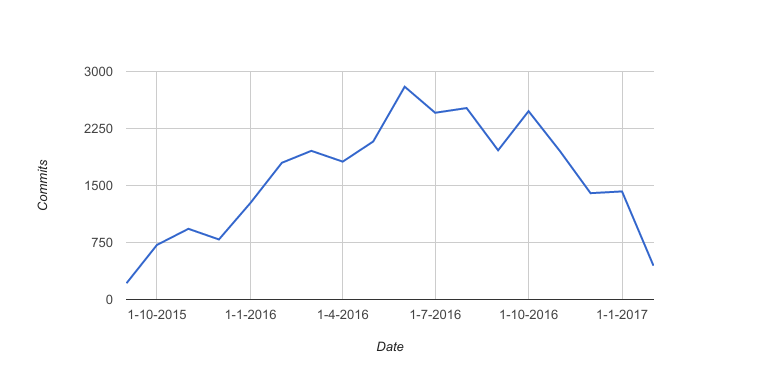
Given a stable team composition, you would expect a more or less flat line. But as you can tell by the graph, the team composition was not stable. We scaled up from 1 team to 2 teams and later on we added 2 extra remote teams to help finish the project on time.
You can even see on the graph the frenzy before the big go-live. That’s the spike in June. We went live in July. I find it wonderful that you can visualize these things by just collecting some metrics from the code repository.
Notice also how things started to slow down recently, which is explained by a decrease in team size, changing the roles of some other people, etc.
About the script itself, I’m not a bash expert but I managed to make it work. Basically, it uses heavily the git rev-list command, which returns a list of commits within a given period. Admittedly, I should’ve used a programming language like Python, but I wanted to try to write it in bash so it has no dependencies at all. If you want to use it for your own project, you’ll probably have to hack a bit the code, but it should be easy enough.
Collecting metrics for number of files and lines of code is a bit different. For every commit, it has to check out the code and measure the local working copy. This can take a while. Also, I am running this through the file command, to exclude binary files from the report. This is even worse speed-wise. If you are working let’s say with Java, you’re better off telling it to only target files with the java extension.
But still it was an interesting exercise and I got the statistics I wanted. I guess one could turn it into an online service in which you provide the URL of a repository and it generates the reports for you every month, with rendered graphs and all. Now that’s a cool project!