Code Coverage is a useful set of metrics that show you how much of your code you’re impacting during testing. It doesn’t say much about the quality of your tests (you can read more in the old post What is code coverage?), but a 30% coverage is definitely worse than 90%. Let’s see how we can use JaCoCo to see our code coverage in the Java world. We’ll check a few options to use it, such as using it manually, using it within a CI, breaking the build with it, etc. The assumption is we’re working with a Maven project.
Let’s start with the easiest option: using it with TeamCity. In this case, you don’t have to do anything in your source code (the pom file). You probably already have a Maven build step in your build configuration which runs your unit tests. All you have to do is to select “JaCoCo” from the Code Coverage drop down:
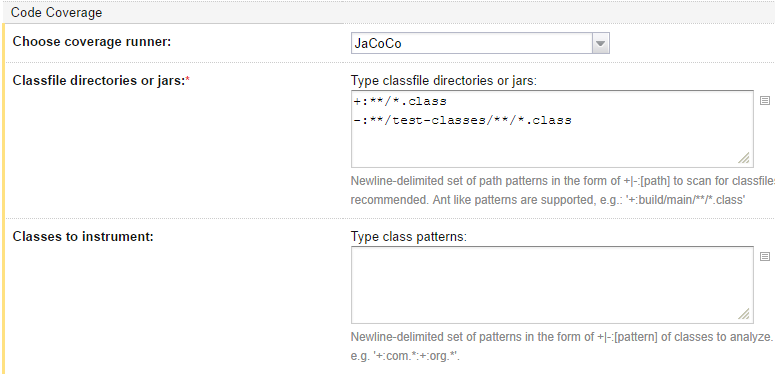
and fill-in the “Classfile directories or jars” field. Test classes are typically excluded (because they will inflate your code coverage numbers) so the patterns specified here are:
+:**/*.class
-:**/test-classes/**/*.class
That’s it actually! This is all it takes to start seeing metrics in TeamCity:
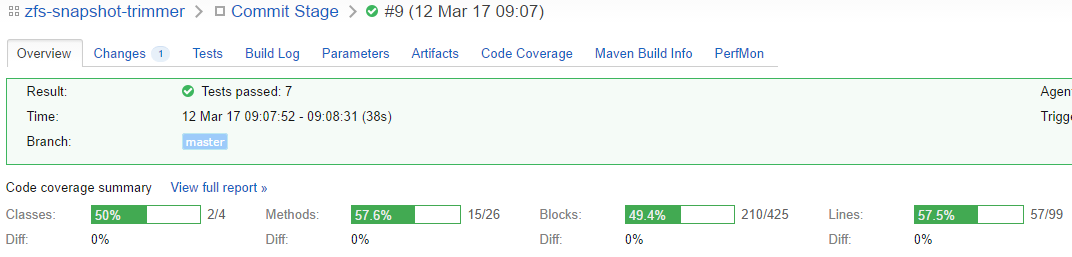
If you follow the Code Coverage tab, you can see the full reports that JaCoCo produces, broken down per package, per file, showing you what you missed. Note that these reports are a JaCoCo feature, so you can also get them without TeamCity.
As you can see, my coverage is quite poor for my pet project. In a real life workplace scenario, this could be a legacy project with a low code coverage. How do you improve this? This is where TeamCity really shines. It supports failing the build on metric changes, compared to the previous metric. So in the screenshot above the coverage is 57.6% for methods? You can configure TeamCity to break the build if it falls below that. And as soon as someone improves the metric, that becomes automatically the new threshold.
This is done by adding a new failure condition:
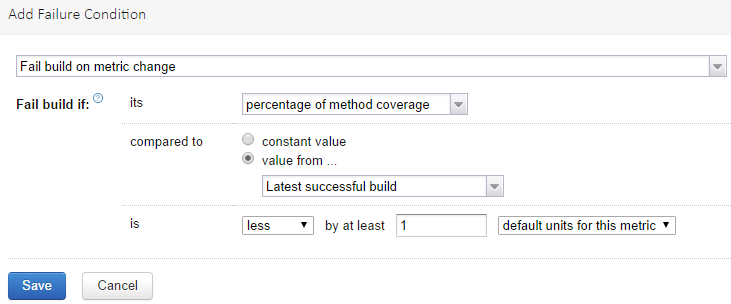
so here if we have a 1% drop, it will break the build. You can configure multiple failure conditions. In my mind, this feature of TeamCity makes it ideal for dealing with legacy projects and getting them in shape progressively.
You can also use JaCoCo locally on your computer. In order to do that you’ll have to modify the pom:
<project>

    <properties>
        <jacoco.maven.plugin.version>0.7.9</jacoco.maven.plugin.version>
    </properties>

    <build>
        <plugins>
            <plugin>
                <groupId>org.jacoco</groupId>
                <artifactId>jacoco-maven-plugin</artifactId>
                <version>${jacoco.maven.plugin.version}</version>
            </plugin>
        </plugins>
    </build>

    <reporting>
        <plugins>
            <plugin>
                <groupId>org.jacoco</groupId>
                <artifactId>jacoco-maven-plugin</artifactId>
                <version>${jacoco.maven.plugin.version}</version>
            </plugin>
        </plugins>
    </reporting>
</project>
Notice that the plugin is placed in both build and reporting plugins (that’s why I added a property variable for the version, to avoid duplication or accidental version mismatch). This type of setup is the least intrusive and allows you to use it both locally and with TeamCity. To get the coverage report, you can run this command:
mvn jacoco:prepare-agent test jacoco:report
This does three things:
- prepares the JaCoCo agent to instrument code
- runs unit tests
- creates the JaCoCo report (the same report that TeamCity offers)
This way you can get the report locally and study it. I find it useful to have the report on one monitor and the IDE in the other and start fixing things. Note IntelliJ also has the option to “Run with Coverage”, which is perhaps the easiest method locally, but I find that a bit less readable (just my taste).
With this setup, JaCoCo does not run by default. It is possible to also have it run by default, which is perhaps useful for a minimalist CI like Travis. In this case you’d have to configure the build plugin a bit different:
<plugin>
    <groupId>org.jacoco</groupId>
    <artifactId>jacoco-maven-plugin</artifactId>
    <version>${jacoco.maven.plugin.version}</version>
    <executions>
        <execution>
            <id>pre-unit-test</id>
            <goals>
                <goal>prepare-agent</goal>
            </goals>
        </execution>
        <execution>
            <id>post-unit-test</id>
            <goals>
                <goal>report</goal>
            </goals>
        </execution>
    </executions>
</plugin>
Notice the executions here. The prepare-agent and report goals are automatically hooked into the lifecycle. If you run mvn verify you will get JaCoCo running before the unit tests and producing the report after the unit tests. This is not compatible with the TeamCity configuration, because then you’ll have Maven starting JaCoCo and TeamCity trying to do the same thing.
JaCoCo also supports breaking the build with the check goal. You can define in the check goal the thresholds that the code must meet (e.g. 60% code coverage). If you don’t have TeamCity and additionally you’re dealing with a brand new project, this could be an option. Set a very high threshold upfront and stick with it.
I have a sample pom configured with a separate profile for Travis. It’s unlikely there’s a real life use case for supporting two CIs in the same pom. It’s more useful as a reference to compare the different ways of configuring JaCoCo in the pom.